
Running a limousine or car rental business in the UAE is becoming more competitive every year. Rising fuel prices, increasing Salik charges, maintenance expenses, driver salaries, insurance premiums, and regulatory compliance costs mean that simply completing more trips no longer guarantees higher profits. This is exactly why fleet break-even analysis has become one of the most important financial metrics for fleet owners in Dubai and Abu Dhabi.
Many fleet operators celebrate completing hundreds of trips every week. Their dashboards show vehicles moving continuously, drivers staying online for long hours, and revenue steadily increasing. On paper, the business appears successful.
However, revenue is only one side of the equation.
A fleet can generate AED 500,000 in monthly revenue while still producing disappointing profits because its operating costs continue to rise unnoticed. Fuel, idle time, empty return trips, unnecessary maintenance, toll charges, driver waiting hours, and administrative inefficiencies quietly reduce margins every single day.
This is where fleet break-even analysis changes the way successful fleet businesses operate.
Instead of asking:
“How many trips did my fleet complete?”
Profitable fleet owners ask:
“How many trips did my fleet need just to cover its costs?”
That single difference separates businesses that simply stay busy from businesses that consistently generate profit.
Understanding your fleet break-even analysis helps you determine the minimum number of trips required before your fleet starts making money. It also provides better visibility into operational performance, pricing strategies, vehicle utilization, and cost management.
Whether you operate a fleet of luxury limousines, executive chauffeur vehicles, airport transfer services, or premium car rentals, knowing your break-even point allows you to make smarter financial decisions based on actual operating data instead of assumptions.
What Is Fleet Break-Even Analysis?
Fleet break-even analysis is the process of calculating the exact point where your fleet’s total revenue becomes equal to its total operating costs.
At this point:
- Every expense has been recovered.
- No profit has been generated.
- No loss has occurred.
Only after crossing this point does every additional profitable trip contribute towards business profit.
Unlike traditional accounting reports that simply show monthly revenue and expenses, fleet break-even analysis helps fleet owners understand exactly how much work each vehicle must complete before it starts earning money.
For limousine and chauffeur businesses operating in the UAE, this calculation becomes particularly important because operating expenses are significantly higher than many operators initially expect.
Your fleet’s break-even point depends on expenses such as:
- Fuel consumption
- Driver salaries and commissions
- Salik toll charges
- Darb toll charges (Abu Dhabi)
- Insurance premiums
- Vehicle financing
- Office rent
- Fleet software subscriptions
- Preventive maintenance
- Tyre replacement
- Vehicle depreciation
- Licensing costs
- RTA and SIRA compliance
- Administrative salaries
Most fleet operators monitor total revenue every day.
Very few monitor how close each vehicle is to breaking even.
Without performing fleet break-even analysis, it becomes almost impossible to answer questions like:
- Which vehicle reaches profitability first?
- Which vehicles never recover their operating costs?
- Which routes generate the healthiest margins?
- Which drivers consistently operate below break-even?
This visibility allows operators to improve profitability without necessarily adding more vehicles.
Why Fleet Break-Even Analysis Matters for UAE Limousine Fleets
The limousine and car rental market in Dubai has evolved significantly over the last few years.
Higher competition means customers expect competitive pricing.
At the same time, operating costs continue increasing.
Today’s fleet owners face multiple financial pressures simultaneously.
Fuel Prices Continue to Affect Margins
Every increase in fuel prices immediately affects cost per trip.
Even if customer pricing remains unchanged, fleet profitability decreases unless operators improve efficiency.
Salik Charges Continue to Increase Operating Costs
Dubai’s expanding toll network means premium chauffeur vehicles frequently cross multiple Salik gates during airport transfers and corporate trips.
Without allocating these costs properly, your true profit per trip becomes inaccurate.
Driver Costs Continue Rising
Experienced chauffeurs expect:
- Higher salaries
- Better incentives
- Bonuses
- Accommodation allowances
While these investments improve service quality, they also increase the break-even point for every vehicle.
Maintenance Costs Increase with Mileage
Luxury vehicles require premium servicing.
BMW.
Mercedes-Benz.
Lexus.
GMC Yukon.
Cadillac Escalade.
Routine servicing, premium tyres, brake systems, suspension components, and engine maintenance cost significantly more than economy vehicles.
Ignoring these costs results in inaccurate profitability calculations.
Insurance Premiums Continue to Rise
Fleet insurance is one of the largest annual expenses for limousine operators.
Claims history, driver behaviour, and vehicle value directly influence premiums.
Better operational control can reduce insurance-related expenses over time.
Compliance Costs Cannot Be Ignored
Operating legally in the UAE requires compliance with multiple regulatory authorities including:
- Dubai RTA
- SIRA
- Abu Dhabi ITC
- Asateel
Compliance costs should always form part of fleet break-even analysis, even though they do not directly relate to individual trips.
Fixed Costs Every Fleet Must Cover
Fixed costs remain relatively constant regardless of how many trips your vehicles complete.
Whether a limousine completes five trips or fifty trips, these expenses continue every month.
Typical Fixed Costs for UAE Limousine Fleets
| Fixed Cost | Example |
|---|---|
| Office Rent | AED 8,000/month |
| Fleet Insurance | Annual premium |
| Vehicle Finance | Monthly EMI/Lease |
| Fleet Software | Monthly subscription |
| Administrative Staff | Finance & Operations |
| Licensing & Permits | RTA / SIRA |
| Internet & Office Utilities | Monthly overhead |
| Accounting & Compliance | Corporate expenses |
For limousine operators in Dubai, licensing and commercial fleet requirements issued by the Roads and Transport Authority (RTA) should always be considered part of the fleet’s fixed operating costs.
Because these expenses remain constant, they must be recovered before your fleet starts generating actual profit.
Many operators underestimate these costs because they don’t directly appear during daily operations.
Variable Costs Per Trip
Unlike fixed costs, variable costs increase every time a vehicle completes another trip.
These costs directly affect your contribution margin and therefore your break-even point.
Common Variable Costs
Fuel
Every kilometre driven increases fuel consumption.
Luxury SUVs consume considerably more fuel than economy sedans.
Driver Commission
Many UAE fleets operate using commission-based payment structures.
Higher trip volumes increase driver payouts.
Salik & Darb
Every toll directly reduces trip profitability if it isn’t allocated correctly.
Maintenance
Higher mileage accelerates:
- Brake wear
- Tyre wear
- Oil changes
- Suspension servicing
Vehicle Cleaning
Premium chauffeur services require vehicles to remain spotless.
Frequent cleaning becomes a recurring operational expense.
Airport Waiting Time
DXB airport pickups often involve long waiting periods.
Drivers remain on duty.
Vehicles idle.
Fuel continues burning.
Revenue remains zero.
Waiting time is one of the most overlooked contributors to rising break-even costs.
Cost Per Trip
Every fleet should know its average cost per completed trip.
Without this number, calculating fleet break-even analysis becomes almost impossible.
How to Calculate Fleet Break-Even Analysis
Understanding the concept of fleet break-even analysis is only the first step. The real value comes from calculating your break-even point using actual operating costs instead of assumptions.
Many UAE limousine businesses estimate profitability by looking at monthly revenue or the number of completed trips. Unfortunately, neither of these figures tells you whether your fleet is actually making money.
A proper fleet break-even analysis combines your fixed costs and variable costs to calculate the minimum number of trips required before your fleet starts generating profit.
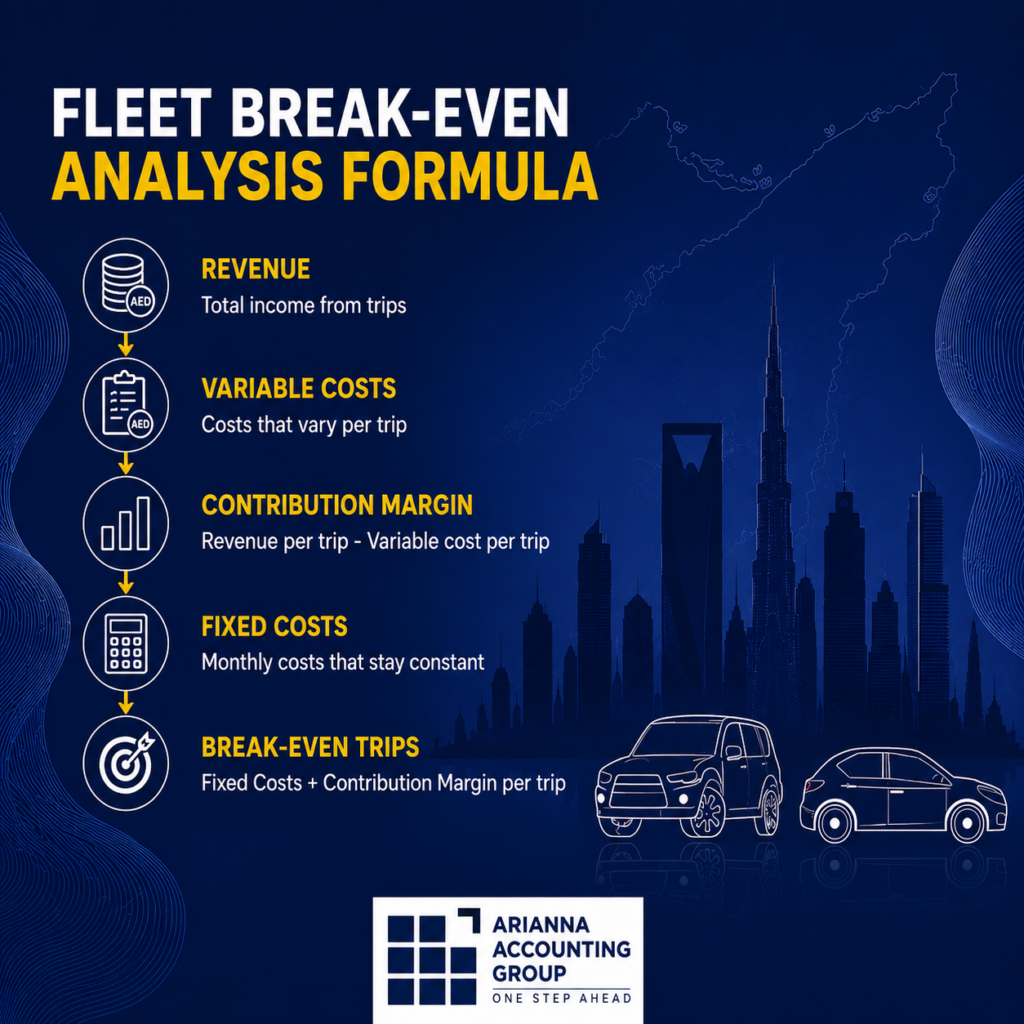
The Fleet Break-Even Formula
The simplest formula is:
Break-Even Trips = Total Fixed Costs ÷ Contribution Margin Per Trip
Where:
Contribution Margin Per Trip = Revenue Per Trip − Variable Cost Per Trip
Contribution margin represents the amount each completed trip contributes toward recovering your fixed operating costs.
Only after all fixed costs are recovered does every additional trip generate profit.
Example: Dubai Limousine Fleet Break-Even Analysis
Let’s assume a limousine company operates 20 luxury vehicles in Dubai.
Monthly Fixed Costs
| Expense | Monthly Cost |
|---|---|
| Office Rent | AED 10,000 |
| Fleet Insurance | AED 12,000 |
| Administrative Salaries | AED 18,000 |
| Fleet Software & Reporting | AED 5,000 |
| Vehicle Financing | AED 40,000 |
| Compliance & Licensing | AED 5,000 |
| Total Fixed Costs | AED 90,000 |
Now let’s calculate the variable cost for a typical airport transfer.
Average Revenue Per Trip
AED 95
Average Variable Cost Per Trip
| Variable Cost | Amount |
|---|---|
| Fuel | AED 18 |
| Driver Commission | AED 22 |
| Salik | AED 8 |
| Vehicle Cleaning | AED 4 |
| Maintenance Provision | AED 8 |
| Total Variable Cost | AED 60 |
Contribution Margin:
AED 95 − AED 60 = AED 35
Now apply the formula.
90,000 ÷ 35 = 2,572 trips
This means the fleet must complete approximately 2,572 profitable trips every month before generating any profit.
If the business completes only 2,300 trips, it may appear busy, but financially it is still operating below its break-even point.
Revenue Is Not the Same as Profit
One of the biggest mistakes fleet owners make is celebrating revenue without understanding costs.
Consider two vehicles.
Vehicle A
- 420 trips
- Revenue: AED 42,000
Vehicle B
- 360 trips
- Revenue: AED 39,000
Most operators immediately assume Vehicle A performed better.
However, after analysing operational expenses:
| Metric | Vehicle A | Vehicle B |
|---|---|---|
| Revenue | AED 42,000 | AED 39,000 |
| Fuel | AED 8,800 | AED 6,500 |
| Salik | AED 3,400 | AED 2,100 |
| Maintenance | AED 4,200 | AED 2,600 |
| Driver Cost | AED 11,200 | AED 9,800 |
| Profit | AED 14,400 | AED 18,000 |
Despite completing fewer trips, Vehicle B generated AED 3,600 more profit.
This is exactly why fleet break-even analysis should focus on profitability rather than activity.
Factors That Increase Your Fleet Break-Even Point
Several operational issues quietly increase the number of trips your fleet must complete before becoming profitable.
1. Excessive Idle Time
Drivers waiting outside airports, hotels, or corporate offices continue consuming fuel while generating zero revenue.
Reducing idle time immediately lowers operating costs.
2. Empty Return Trips
Dropping a passenger in Abu Dhabi and returning empty to Dubai creates fuel, toll, and depreciation costs without generating income. Operators managing inter-emirate services should also monitor compliance with Abu Dhabi Mobility requirements when planning fleet operations.
Monitoring dead mileage significantly improves break-even performance.
3. Poor Route Planning
Inefficient routing increases:
- Fuel consumption
- Driver hours
- Salik charges
- Vehicle wear
Every unnecessary kilometre raises the fleet’s break-even point.
4. High Driver Dependency
When one or two drivers generate a disproportionate share of fleet revenue, the business becomes vulnerable.
Balanced driver utilisation creates more predictable profitability.
5. Rising Maintenance Costs
Ignoring preventive servicing often leads to expensive repairs and longer vehicle downtime.
Routine maintenance usually reduces total operating costs over the long term.
6. Unallocated Operating Expenses
Many businesses fail to allocate costs such as:
- Salik
- Fuel
- Cleaning
- Waiting time
- Administrative expenses
As a result, reported profitability appears much higher than reality.
Accurate allocation is essential for meaningful fleet break-even analysis.
Common Mistakes Fleet Owners Make
Even experienced fleet operators often miscalculate profitability because they rely on incomplete information.
Some of the most common mistakes include:
- Measuring success using trip count instead of contribution margin.
- Ignoring fixed overhead while calculating vehicle profitability.
- Treating fuel as the only operational expense.
- Failing to account for tolls, waiting time, and maintenance.
- Using monthly revenue reports without analysing cost per trip.
- Comparing drivers using completed trips rather than net profit generated.
- Making pricing decisions without understanding the fleet’s break-even point.
These mistakes gradually increase operational costs and make sustainable profitability much harder to achieve.
How Fleet Analytics Helps Lower Your Break-Even Point
Calculating your fleet break-even analysis is only the beginning. The real objective is to reduce the number of trips required before your fleet starts generating profit.
This is where fleet analytics creates measurable business value.
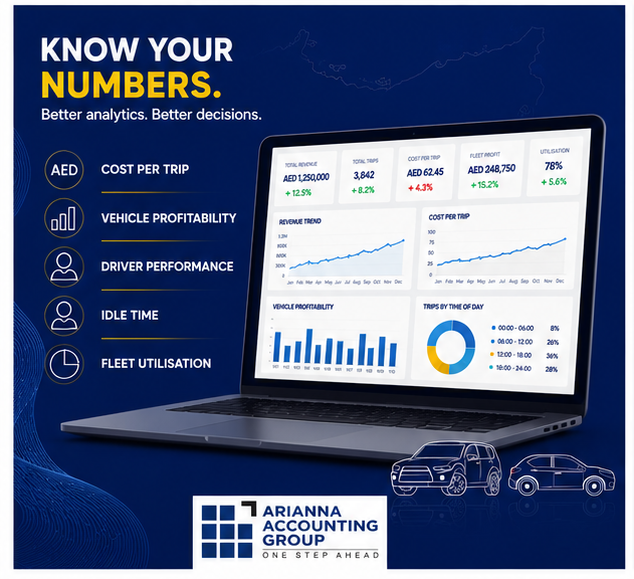
Instead of simply reporting completed trips and total revenue, modern fleet analytics identifies exactly where operational costs are increasing and which improvements will have the greatest impact on profitability.
For UAE limousine and car rental businesses, even small operational improvements across multiple vehicles can significantly reduce the fleet’s break-even point.
Reduce Idle Time
Idle vehicles continue consuming fuel while generating no revenue.
By monitoring idle time at airports, hotels, and high-demand waiting zones, fleet operators can identify unnecessary waiting periods and improve vehicle utilisation.
Reducing just 30 minutes of unnecessary idling per vehicle every day can generate substantial fuel savings across an entire fleet.
Improve Vehicle Utilisation
Not every vehicle contributes equally to profitability.
Some vehicles remain active throughout the day, while others spend long periods parked or waiting for bookings.
Vehicle utilisation analytics helps operators identify:
- Underperforming vehicles
- Vehicles completing fewer trips
- Vehicles spending excessive time offline
- Peak demand periods
A balanced fleet reduces dependency on a small number of high-performing vehicles while improving overall profitability.
Monitor Cost Per Trip
Many fleet operators monitor total monthly expenses but never calculate the actual cost of completing each trip.
Knowing your cost per trip allows you to:
- Price services accurately
- Compare vehicle profitability
- Evaluate route efficiency
- Measure operational improvements
Without cost-per-trip visibility, reducing your fleet’s break-even point becomes difficult.
Improve Driver Performance
Driver behaviour has a direct impact on operational costs.
Aggressive acceleration, harsh braking, unnecessary idling, poor route choices, and inefficient driving patterns all increase:
- Fuel consumption
- Tyre wear
- Maintenance costs
- Vehicle downtime
Performance reporting helps identify coaching opportunities while improving overall fleet efficiency.
Reconcile Every Trip
Revenue leakage remains one of the biggest challenges for limousine and car rental businesses.
If completed trips are not properly reconciled with platform reports, customer invoices, and driver earnings, businesses may lose revenue without recognizing the issue.
Trip reconciliation ensures that every completed journey contributes towards recovering operating costs.
Allocate Operating Costs Accurately
Expenses such as:
- Salik
- Darb
- Fuel
- Cleaning
- Driver commissions
- Maintenance
should all be allocated at the trip or vehicle level whenever possible.
Proper allocation provides a much more accurate fleet break-even analysis than relying on monthly expense summaries alone.
How Arianna Helps Fleet Owners Improve Break-Even Performance
At Arianna Accounting & Analytics, we understand that profitability isn’t determined by the number of trips your fleet completes.
It is determined by how efficiently every vehicle operates.
Our reporting and analytics solutions help UAE limousine and car rental businesses gain complete visibility into the operational factors affecting profitability.
Instead of relying solely on revenue reports, fleet owners receive detailed insights including:
- Vehicle-level profitability
- Cost per trip analysis
- Driver performance reporting
- Fleet utilisation reporting
- Fuel and idle time analysis
- Trip reconciliation
- Salik and toll reconciliation
- Daily, weekly and monthly management reports
- Financial reporting and operational dashboards
By combining accounting data with operational analytics, businesses can identify where costs are increasing, where revenue is leaking, and which operational improvements will reduce their break-even point.
Rather than making decisions based on assumptions, fleet operators gain access to accurate reporting that supports long-term profitability.
Final Thoughts
The success of a UAE limousine or car rental business should never be measured solely by the number of trips completed.
Busy vehicles do not always generate profitable businesses.
A fleet that understands its fleet break-even analysis can make better decisions about pricing, vehicle utilisation, driver performance, operational efficiency, and long-term growth.
When every operational expense is measured correctly, managers gain a much clearer understanding of which vehicles are contributing to profitability and which areas require improvement.
In today’s competitive transport market, profitability depends on visibility.
Knowing your break-even point is no longer optional.
It has become one of the most important financial metrics every fleet owner should monitor.
Frequently Asked Questions
What is fleet break-even analysis?
Fleet break-even analysis calculates the number of trips or the amount of revenue required for a fleet to recover all fixed and variable operating costs before generating profit.
Why is fleet break-even analysis important for UAE limousine businesses?
It helps fleet owners understand how many trips each vehicle must complete before becoming profitable while improving pricing decisions, cost control, and operational efficiency.
What costs should be included in fleet break-even analysis?
A complete fleet break-even analysis should include:
- Fuel
- Driver salaries and commissions
- Salik and Darb tolls
- Maintenance
- Insurance
- Vehicle financing
- Office expenses
- Fleet software
- Licensing and compliance
- Administrative costs
Does higher revenue always mean higher profitability?
No.
Higher revenue often comes with higher operating expenses.
Without measuring operating costs alongside revenue, businesses may appear successful while actually operating below their break-even point.
How can fleet analytics improve break-even performance?
Fleet analytics improves profitability by identifying:
- Idle vehicles
- Underperforming assets
- Fuel inefficiencies
- Driver behaviour
- Trip reconciliation issues
- Vehicle utilisation
- Cost per trip
These insights help reduce operational costs and lower the number of trips required to reach profitability.
Want to know exactly when your fleet starts making money?
Arianna Accounting & Analytics helps UAE limousine and car rental businesses move beyond revenue tracking with trip-level profitability, fleet utilisation analytics, reconciliation, reporting, and financial insights that improve operational performance.
Better visibility leads to better decisions—and better decisions lead to higher profitability.